Most crypto investors have heard the buzz around chart patterns — but few take the time to actually understand what they mean.
One pattern that reliably stirs excitement in the XRP community is a formation called the golden cross, and knowing how to interpret it correctly can sharpen your decision-making as a trader.
This guide walks you through the mechanics behind this technical signal, what Ripple’s history reveals about it, and — just as crucially — where the pattern falls short.
Moving Averages: The Foundation You Need to Grasp First
Before diving into the golden cross itself, it helps to get comfortable with moving averages.
Picture a weather app that doesn’t just show today’s temperature — it shows the average over the past week or the past month.
That’s essentially what a moving average does for an asset’s price: it smooths out the daily swings so you can spot the underlying direction.
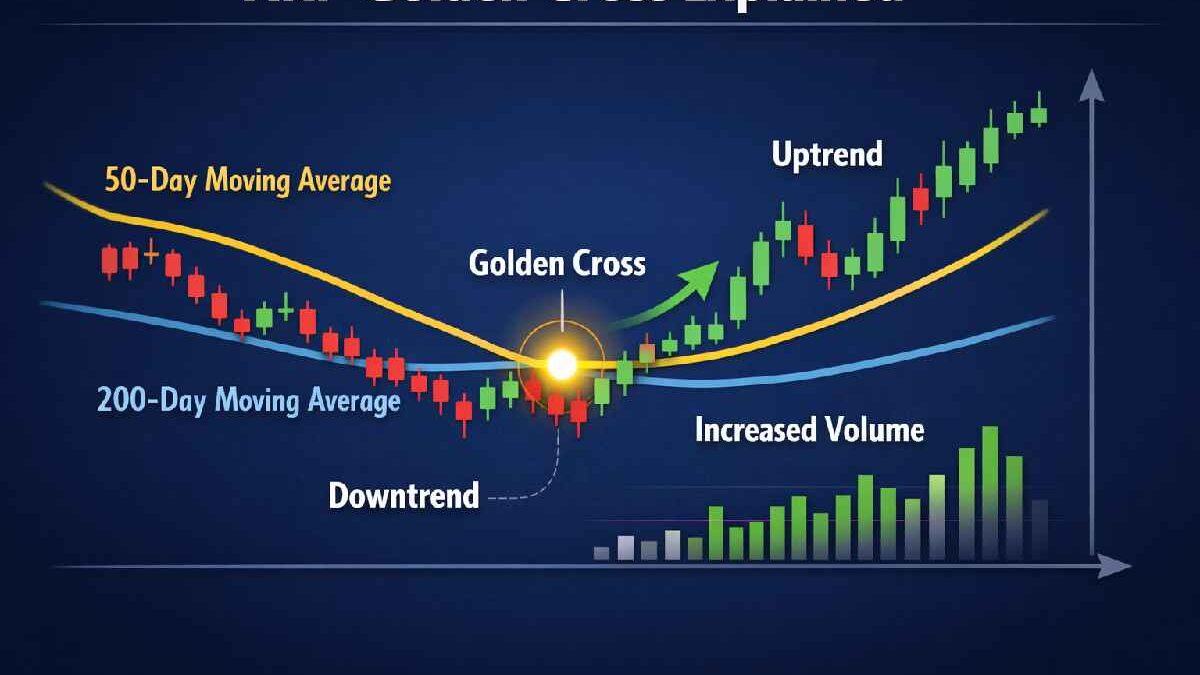
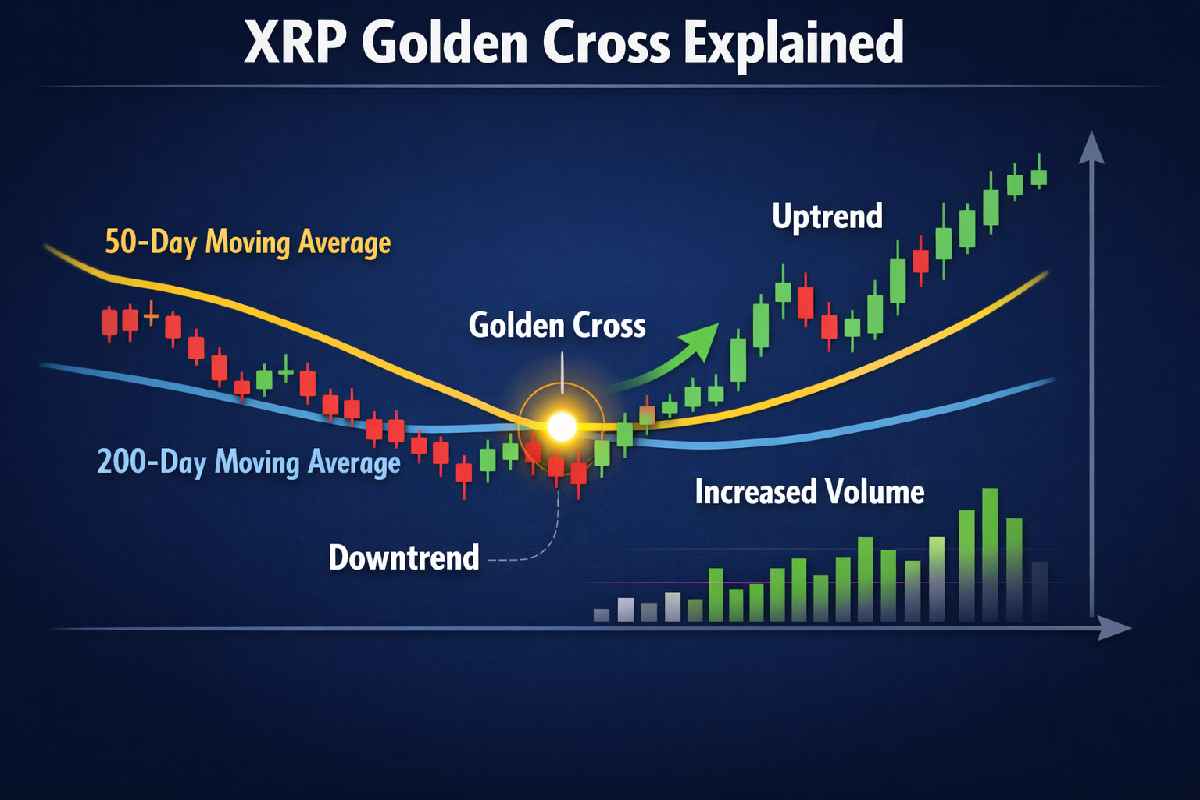
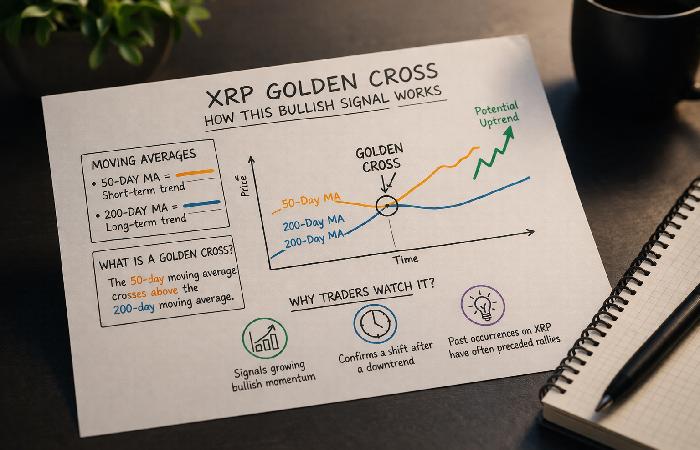
In technical analysis, two moving averages take center stage — the 50-day and the 200-day.
The 50-day reflects where prices have been in the near term, while the 200-day captures the longer arc of market sentiment.
Watching how these two lines relate to each other is what makes patterns like the XRP golden cross so closely followed by traders.
When the 50-day climbs above the 200-day, bulls interpret it as a green light — recent momentum is outpacing the long-run average, and buyer demand appears to be growing.
The flip side of this setup, where the 50-day dips beneath the 200-day, goes by an equally vivid name: thedeath cross, and it points in the opposite direction.
A Signal That Brews Slowly — Not All at Once
One thing beginners often misunderstand is that a golden cross doesn’t pop up randomly on a Tuesday morning.
It develops gradually through a sequence that most analysts break into three chapters.
The first chapter is a prolonged period of weakness, where XRP has been underperforming and the 50-day sits comfortably below the 200-day.
Sellers dominate during this stretch, but patient investors often begin quietly accumulating here — well before any signal is visible on the chart.
The second chapter is the actual crossover event: the 50-day finally nudges above the 200-day, officially triggering the golden cross.
Here’s a detail worth noting — the volume accompanying this crossover tells you a lot about its credibility.
A crossover on heavy trading activity suggests genuine conviction behind the move; one that happens in thin, low-volume conditions is far easier to question.
The third chapter is where the real test begins: does XRP hold its ground above both moving averages once the dust settles?
A token that sustains its position above these two lines in the days and weeks after the crossover sends a much stronger signal than one that dips back down almost immediately.
What XRP’s Own Track Record Reveals
Confirmed golden crosses on XRP’s daily chart are not common — that scarcity is exactly what makes the market pay attention each time one appears.
Looking back at 2017, the signal emerged when XRP was practically worthless in dollar terms.
What followed was one of the most dramatic rallies in the token’s history, with its price climbing into multi-dollar territory before the year closed out.
A comparable setup showed up again during 2021’s broader crypto upswing, with XRP posting meaningful percentage gains in the months after the crossover printed.
By early 2024, another standard golden cross formation appeared, again coinciding with a stretch of positive price movement.
More recently — January 2026 — a variation of the pattern emerged involving shorter-term moving averages, which traders read as a near-term bullish signal even though it differed from the classic 50/200-day setup.
What adds texture to these historical moments is the regulatory shift that reshaped XRP’s story: after years of legal uncertainty, U.S. courts determined that XRP does not qualify as a security — clearing a cloud that had long weighed on investor confidence.
Institutional money began finding its way into the asset more freely after that ruling, and the November 2025 launch of spot XRP ETFs in the United States added another dimension to how market participants were sizing up the current XRP opportunity.
The Part Traders Often Skip Over
Here’s the uncomfortable truth about any lagging indicator: by definition, it only tells you what already happened.
The golden cross is built from past closing prices, which means the signal always arrives late to the party.
When it finally appears on the chart, XRP has already recovered meaningfully from its lows — the best entry prices have often passed, and buyers chasing the crossover are stepping in after the move is partially complete.
There’s also the matter of false breakouts.
A golden cross can print and then fail to follow through if broader market conditions deteriorate, a macro shock hits, or trading volume simply doesn’t hold up.
Charts do not exist in a vacuum, and no technical pattern can override negative news flow or a market-wide panic.
Seasoned traders consistently pair the golden cross with other analytical tools — RSI readings, MACD divergence, key support levels, and on-chain activity — to build a more complete picture before committing to a position.
Treating any single indicator as a standalone buy signal is one of the fastest ways to make costly mistakes in volatile markets.
Conclusion
The golden cross has earned its reputation in XRP circles for good reason — its historical appearances have often coincided with notable price recoveries.
But understanding where the signal comes from and what it cannot tell you is what separates informed decision-making from blind pattern-chasing.
Stay current on XRP’s live chart, technical signals, and market data at MEXC to put this knowledge to practical use.